Sales Performance Analysis Report 2024-2026
Comprehensive Analysis of Product Sales Across Global Markets
Analyst: Data Analysis Portfolio Showcase
Period Analyzed: January 4, 2024 - December 17, 2026
Report Date: February 13, 2026
Executive Summary
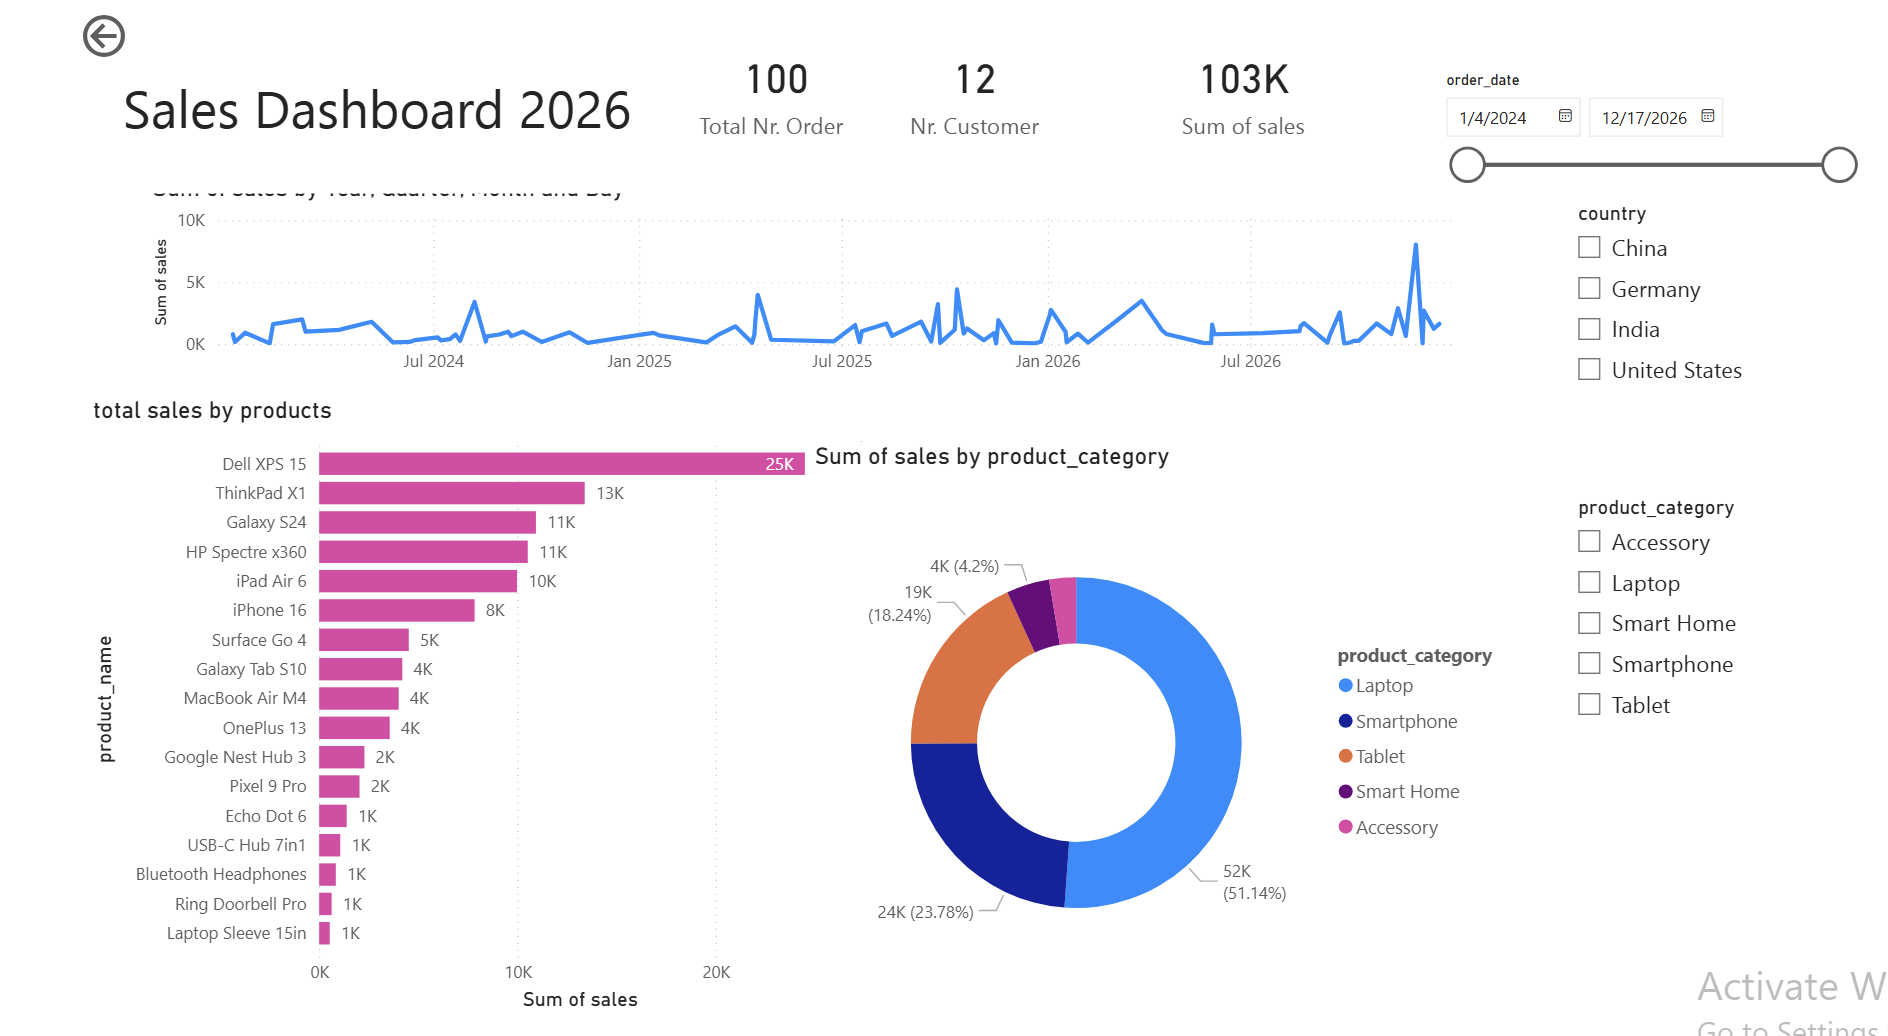
This report presents a comprehensive analysis of sales performance data spanning nearly three years (2024-2026), encompassing 100 orders from 12 unique customers across four international markets. The analysis reveals total sales of $103,000, with significant insights into product category performance, temporal sales patterns, and market distribution.
Key Findings:
- Laptops dominate sales revenue, accounting for 51.4% ($52,000) of total sales
- Dell XPS 15 emerges as the top-performing individual product with $25,000 in sales
- Sales patterns exhibit notable seasonal variations with significant peaks in late 2025 and 2026
- Product portfolio spans five categories with 17 distinct products across technology and smart home segments
- Average order value stands at $1,030, indicating a focus on mid-to-high value technology products
1. Introduction
1.1 Background and Context
This analysis examines sales data from a technology retail operation serving international markets. The dataset encompasses transaction records over a 35-month period, providing robust temporal coverage for identifying trends, seasonal patterns, and product performance dynamics. The business model focuses on consumer electronics, including laptops, smartphones, tablets, smart home devices, and accessories.
1.2 Objectives
The primary objectives of this analysis include:
- Evaluate overall sales performance and key performance indicators (KPIs)
- Identify top-performing products and product categories
- Analyze temporal trends and seasonal patterns in sales data
- Assess product portfolio distribution and concentration
- Provide actionable recommendations for business optimization
1.3 Methodology
The analysis employs descriptive analytics techniques, including:
- Time series analysis for trend identification
- Category-based segmentation and comparison
- Product-level performance ranking
- Visual data exploration through dashboard interpretation
- Percentage contribution analysis
Data visualization techniques include line charts for temporal trends, horizontal bar charts for product comparisons, and donut charts for category distribution analysis.
2. Data Overview
2.1 Key Performance Indicators
The dashboard presents three critical KPIs that summarize overall business performance:
| Metric | Value |
|---|---|
| Total Number of Orders | 100 |
| Number of Unique Customers | 12 |
| Total Sales Revenue | $103,000 |
| Average Order Value | $1,030 |
| Average Orders per Customer | 8.33 |
2.2 Dataset Characteristics
Temporal Coverage: The dataset spans from January 4, 2024, to December 17, 2026, providing 35 months of transaction data. This extended time frame enables robust seasonal pattern identification and year-over-year comparisons.
Customer Base: With 12 unique customers generating 100 orders, the analysis reveals an average of 8.33 orders per customer, indicating strong customer retention and repeat business patterns.
Product Portfolio: The dataset includes 17 distinct products organized into five main categories: Laptops, Smartphones, Tablets, Smart Home Devices, and Accessories.
Download Full Report: Sales Dashboard Analysis Report (PDF)