Building a Modern SQL Data Warehouse with Medallion Architecture
Project Overview
This project implements a SQL-based data warehouse using a Medallion architecture (Bronze → Silver → Gold) to integrate CRM and ERP CSV files into a single analytics-ready environment. The warehouse supports customer and sales analysis, from raw data ingestion all the way to Tableau dashboards built on top of a star-schema sales data mart.
Objectives
- Integrate CRM and ERP data into a centralized warehouse.
- Apply Medallion design with clearly separated Bronze, Silver, and
Gold layers.
- Design a star-schema sales data mart for self-service analytics.
- Build a customer-focused analytics view with value and recency
metrics.
- Deliver dashboards that surface sales trends and customer
segments.
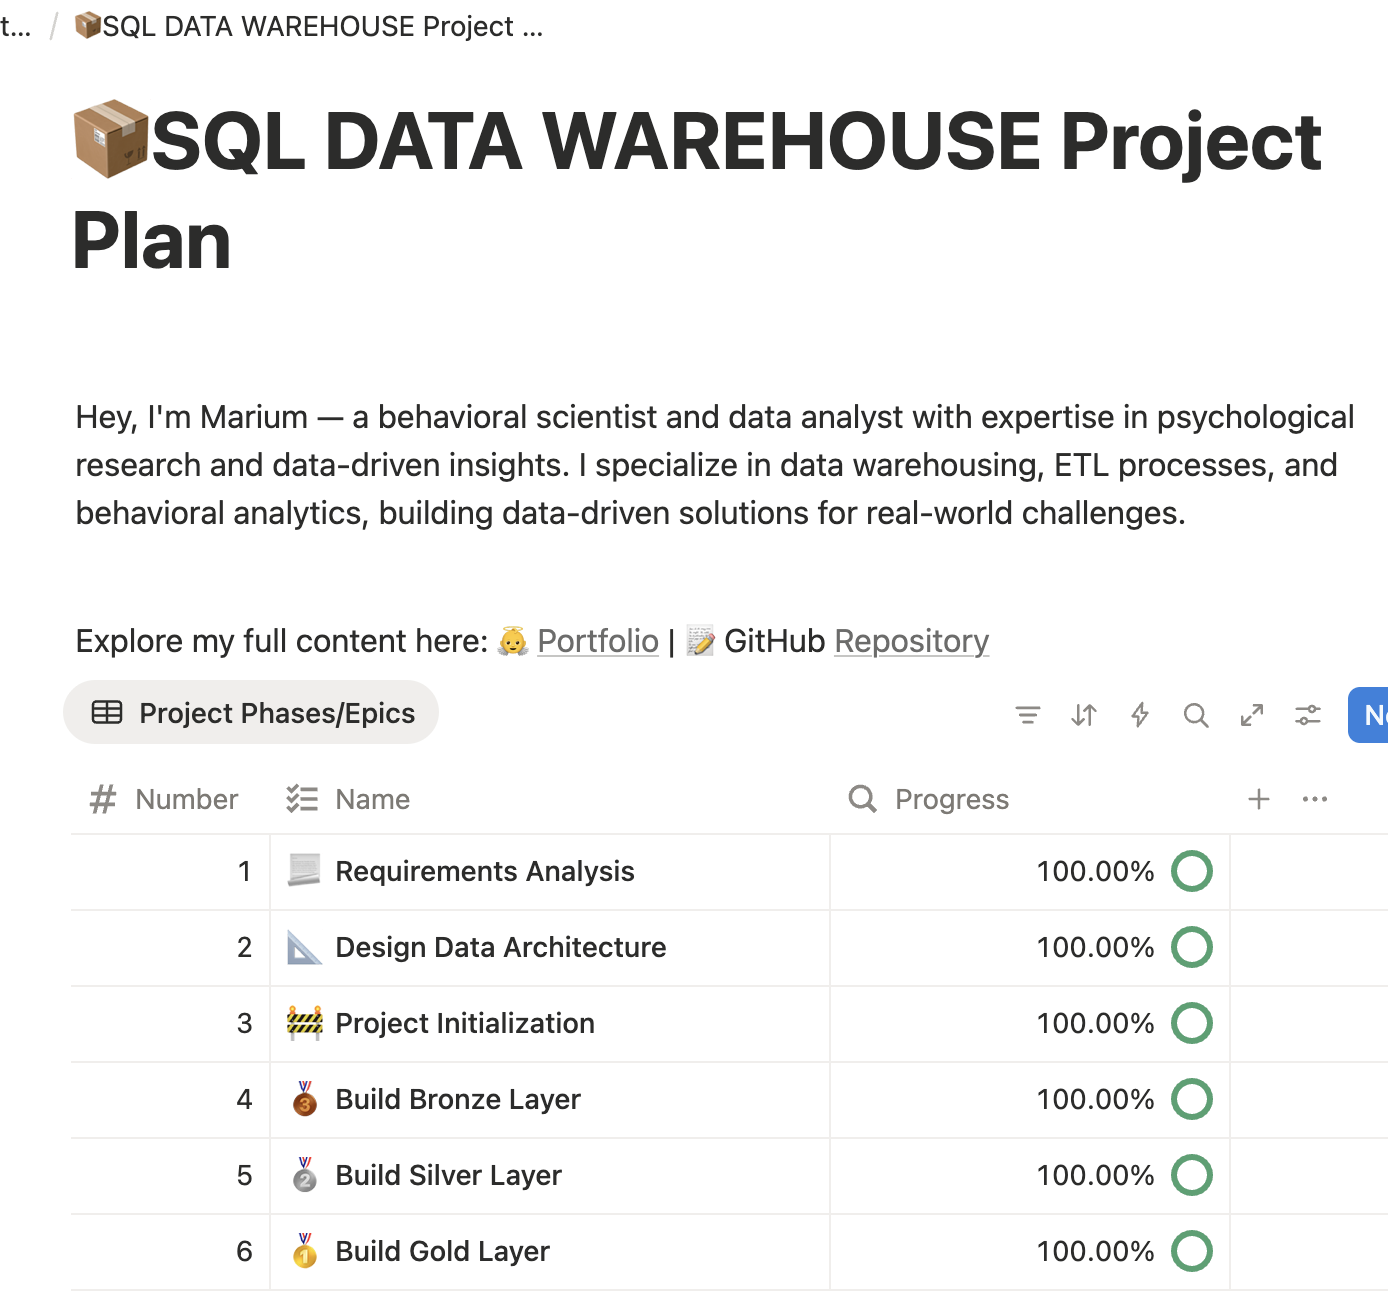
Project Planning in Notion
I used Notion to break the project into tasks such as requirement gathering, data exploration, data modeling, SQL development, quality checks, and dashboard design. Kanban-style boards and checklists helped me track each layer (Bronze, Silver, Gold) and the dependencies between them.
Data Architecture and Flow
The warehouse ingests CSV files from CRM and ERP systems into a Bronze layer, standardizes and enriches them in the Silver layer, and exposes business-ready data in the Gold layer. The following diagrams show the high-level flow, the layer responsibilities, and the final star-schema design of the sales data mart.
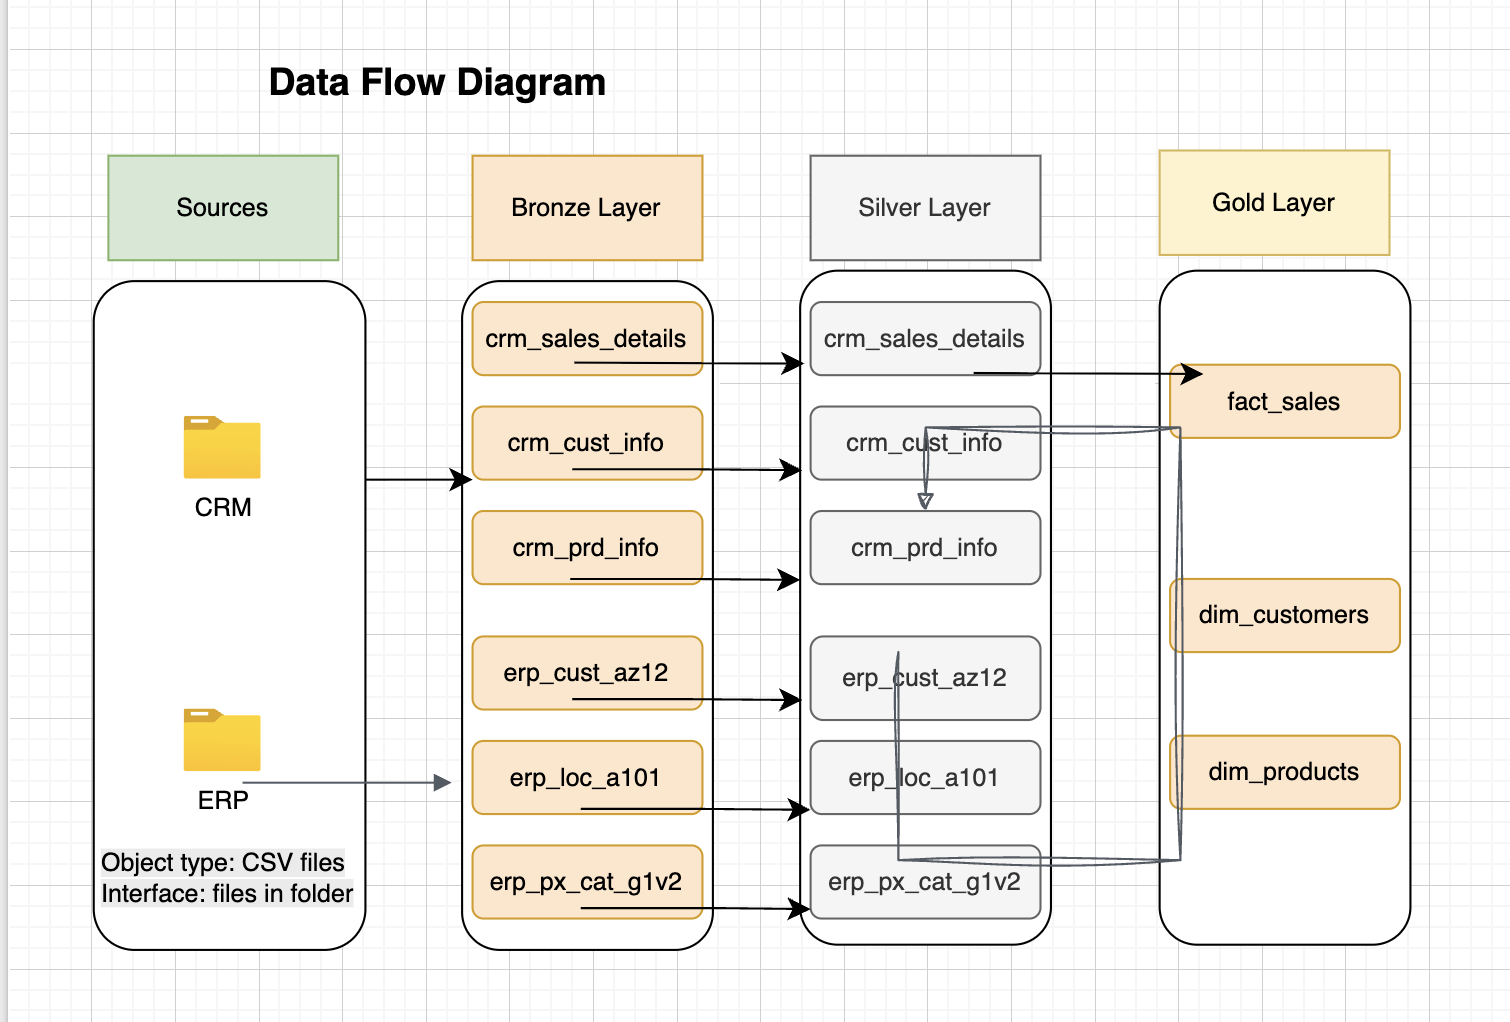
Data Flow Diagram
This diagram illustrates how each source table from CRM and ERP
flows into Bronze, is copied into Silver, and then contributes to
Gold-layer objects such as fact_sales,
dim_customers, and dim_products.
Warehouse Layers and Responsibilities
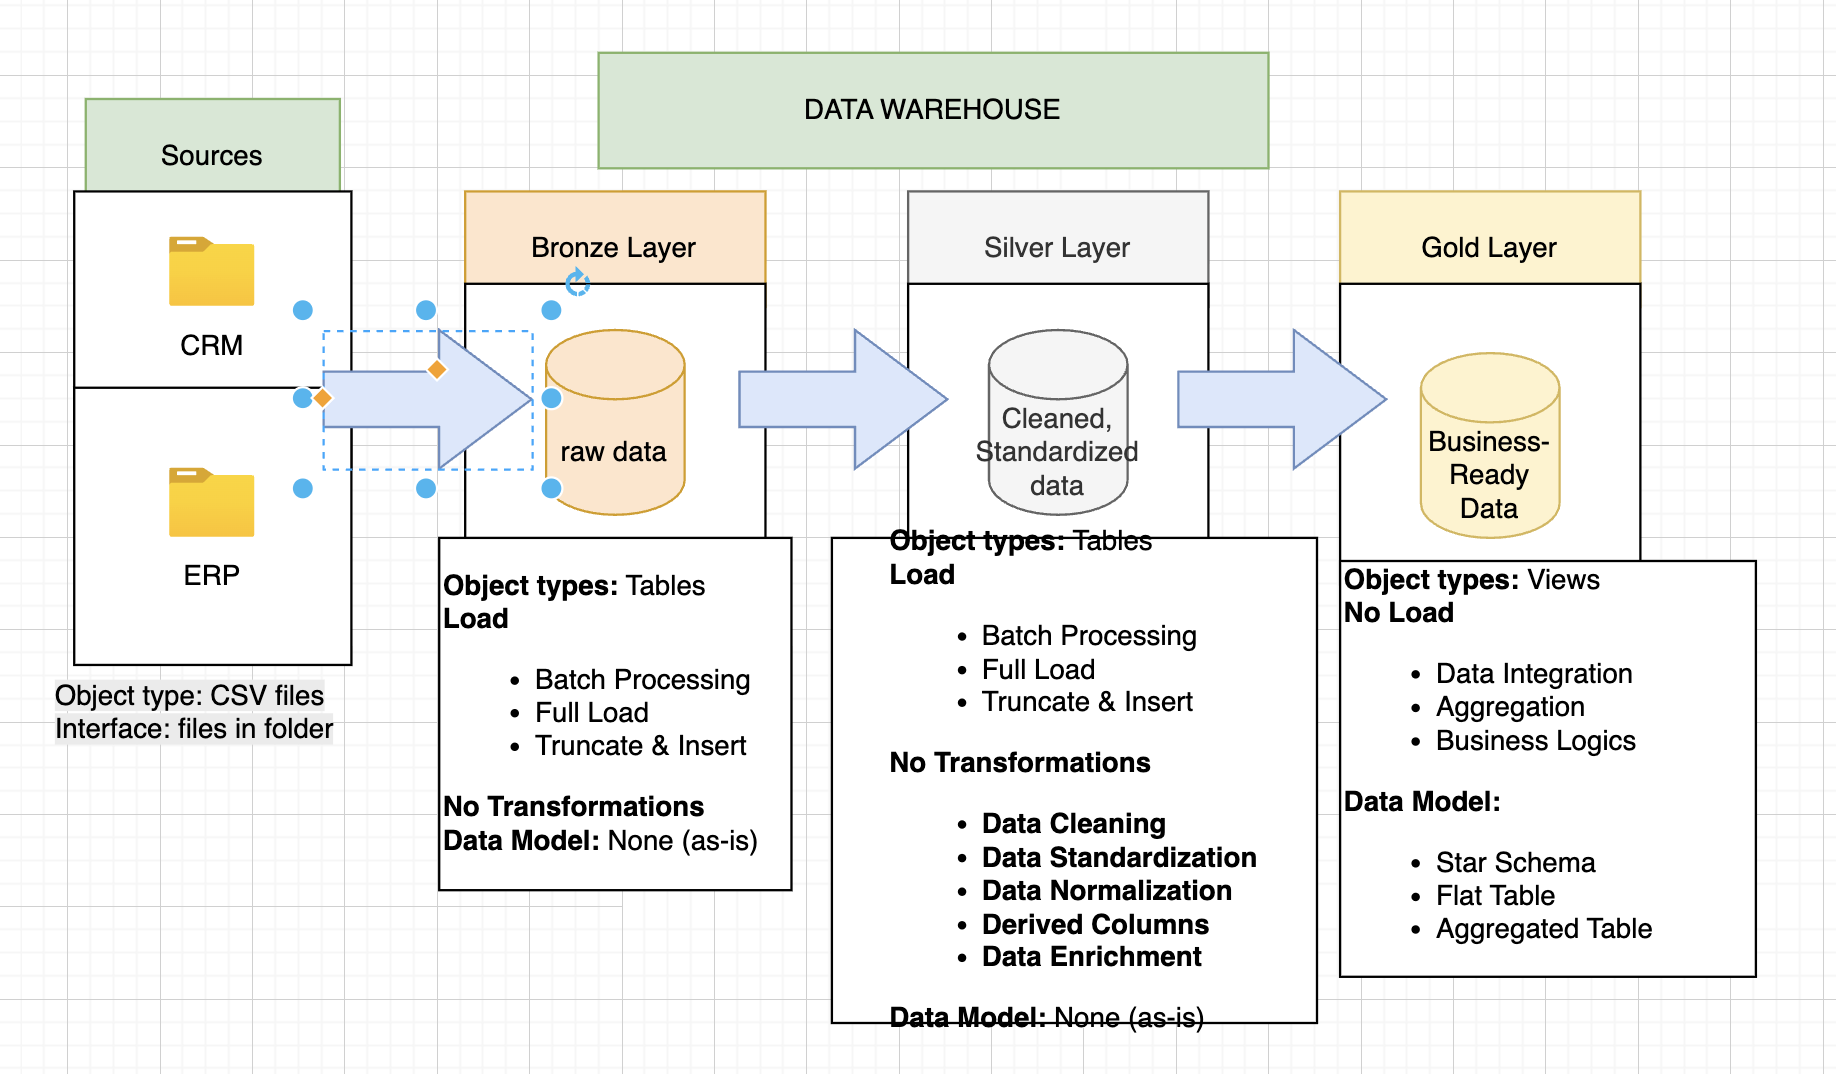
The second diagram summarizes how each layer is used: Bronze stores raw tables, Silver stores cleaned and standardized tables, and Gold exposes business-ready views built with star-schema and aggregated tables. It also highlights load strategies such as batch processing and full reloads.
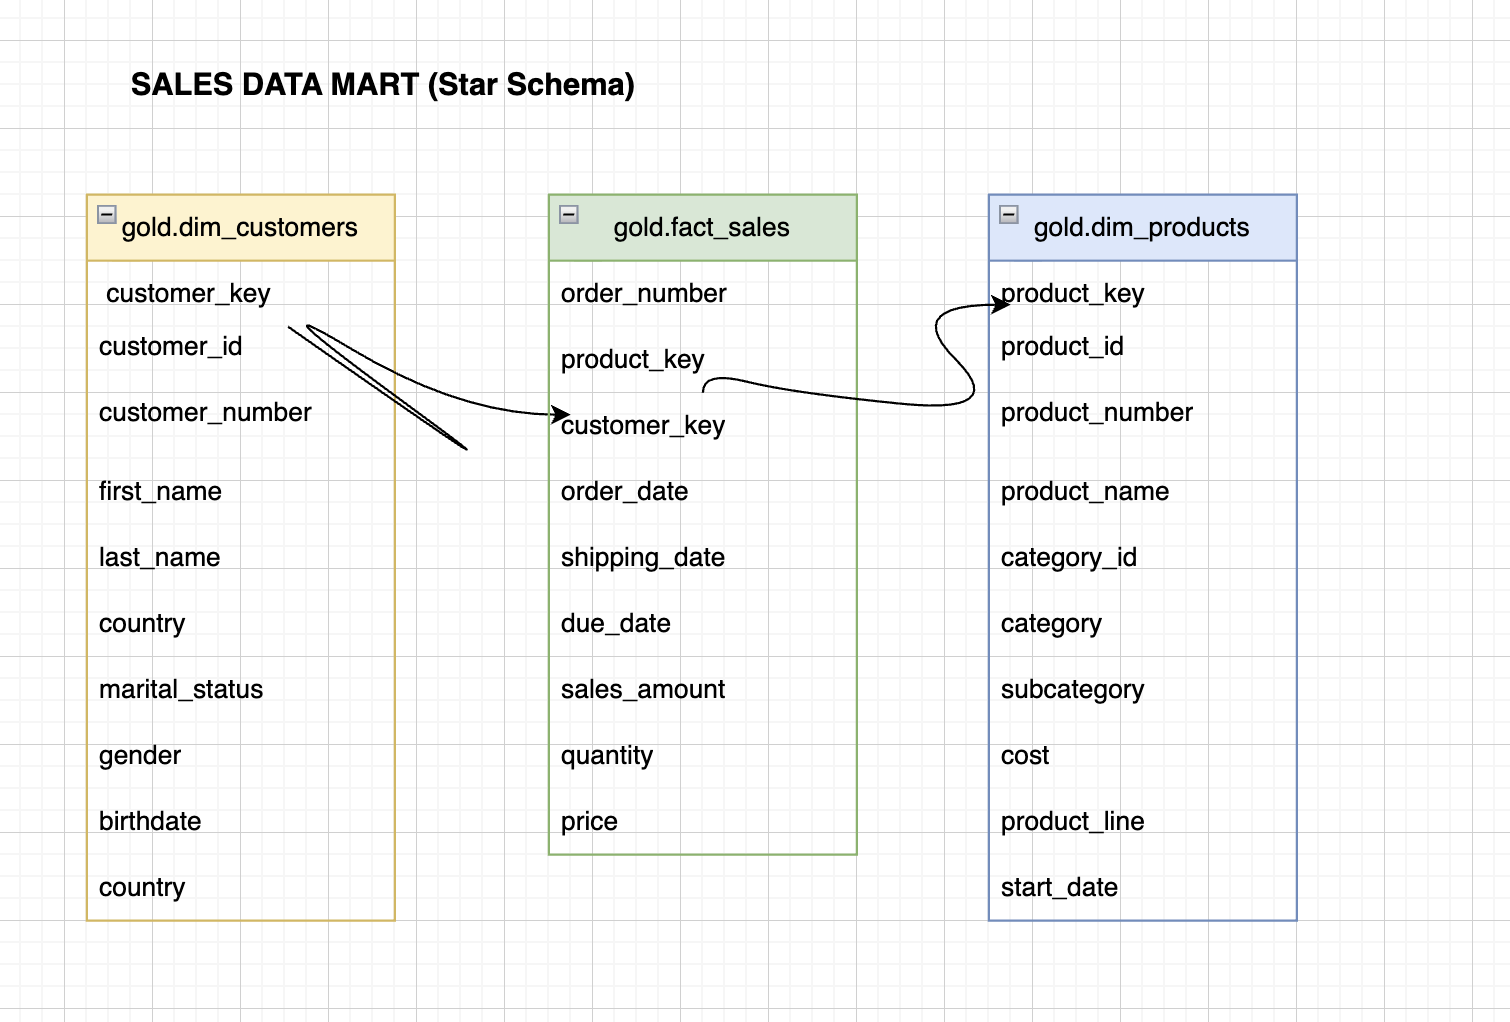
Sales Data Mart (Star Schema)
The sales data mart follows a classic star schema with one fact
table and two core dimensions. gold.fact_sales
contains one row per order line, linked to
gold.dim_customers and
gold.dim_products via surrogate keys. This structure
makes it easy to slice metrics such as revenue and quantity by
customer attributes (country, age, gender) and product attributes
(category, subcategory, product line).
Bronze Layer – Raw Ingestion
The Bronze layer stores raw copies of CRM and ERP CSV files. Tables mirror the structure of the source systems: CRM sales details, customer information, product details, and ERP customers, locations, and pricing categories. Only light technical cleaning is applied (type casting and obvious null handling), preserving full lineage for auditability.
Silver Layer – Cleaned & Conformed Data
In the Silver layer, I standardized customer identifiers, cleaned text fields, validated dates and numeric values, and ensured that all sales records link consistently to customer and product entities. This layer contains conformed tables such as unified customers, enriched products, and validated sales.
Gold Layer – Business-Ready Marts
The Gold layer contains the star-schema sales data mart and
business-friendly views. Key objects include
dim_customers, dim_products,
dim_date, and fact_sales, as well as a
customer analytics view that aggregates customer-level metrics used
in dashboards.
Customer Analytics View
I created a dedicated view that aggregates customer performance and behavior using the Gold layer. For each customer, the view reports total orders, total sales, quantity purchased, number of distinct products, recency (days since last order), lifespan (days between first and last order), average order value, and average monthly spend. Customers are then grouped into segments such as VIP, Regular, or Occasional based on revenue thresholds, and can also be analyzed by age_group and geographic attributes.
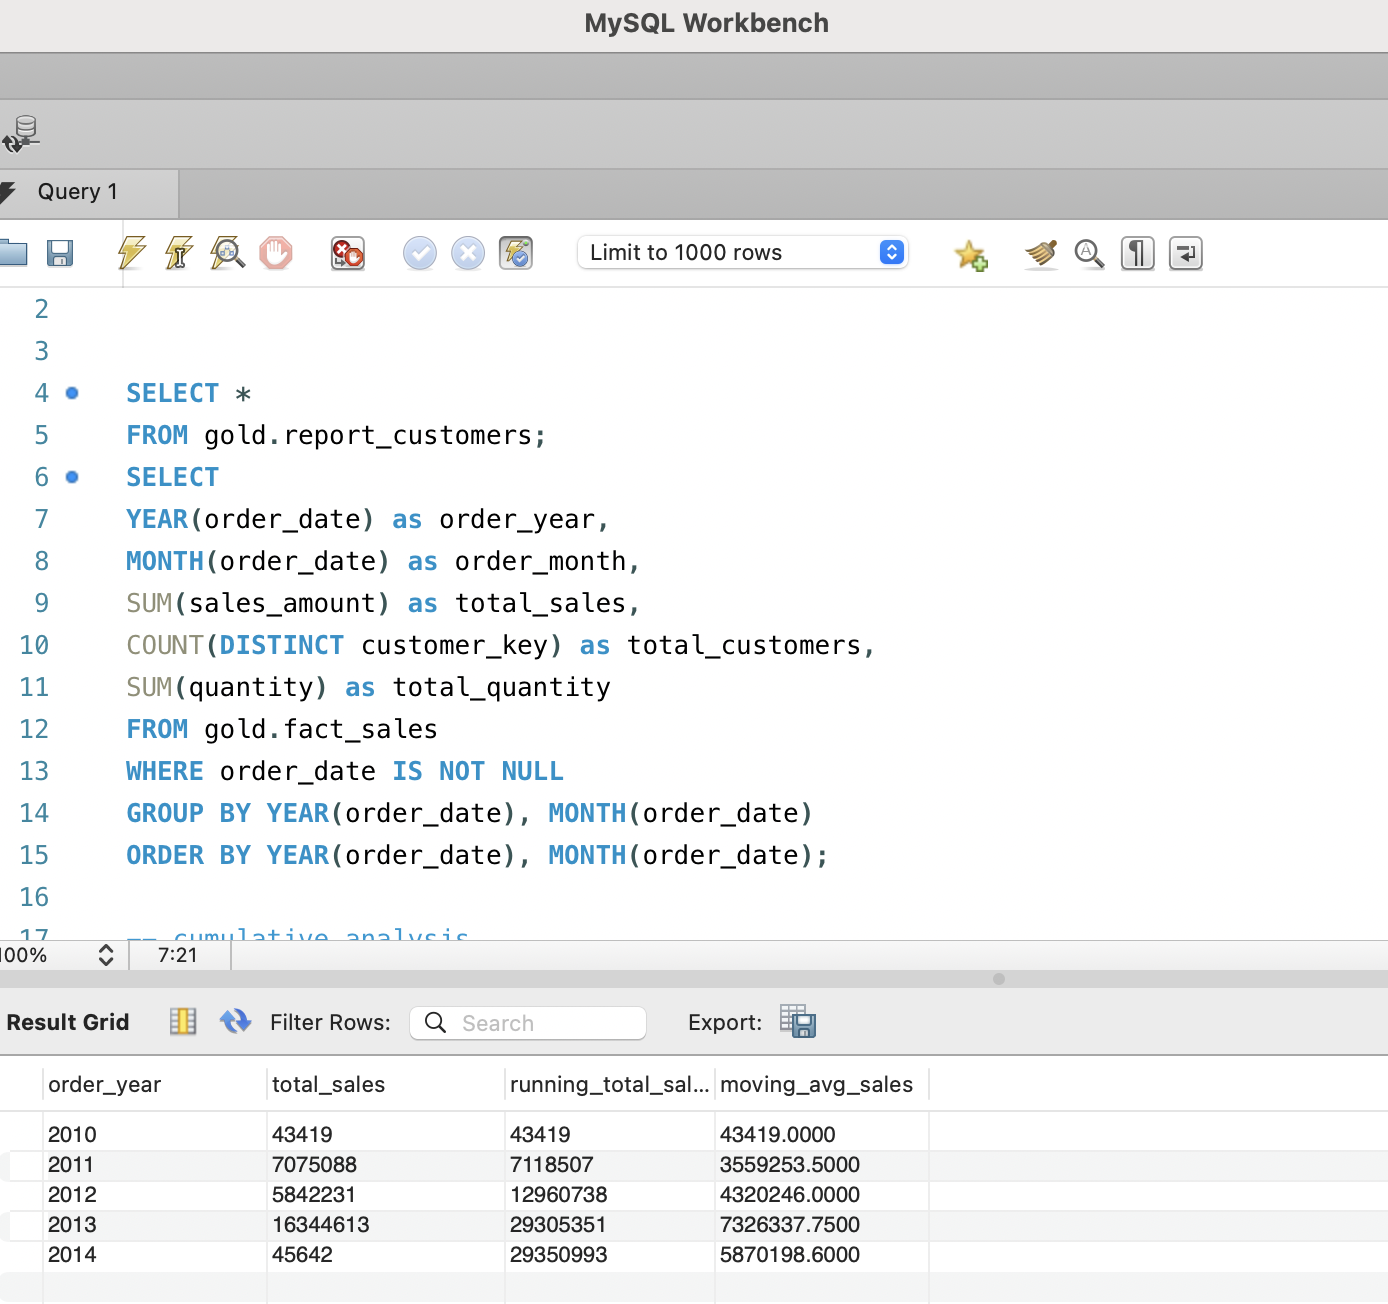
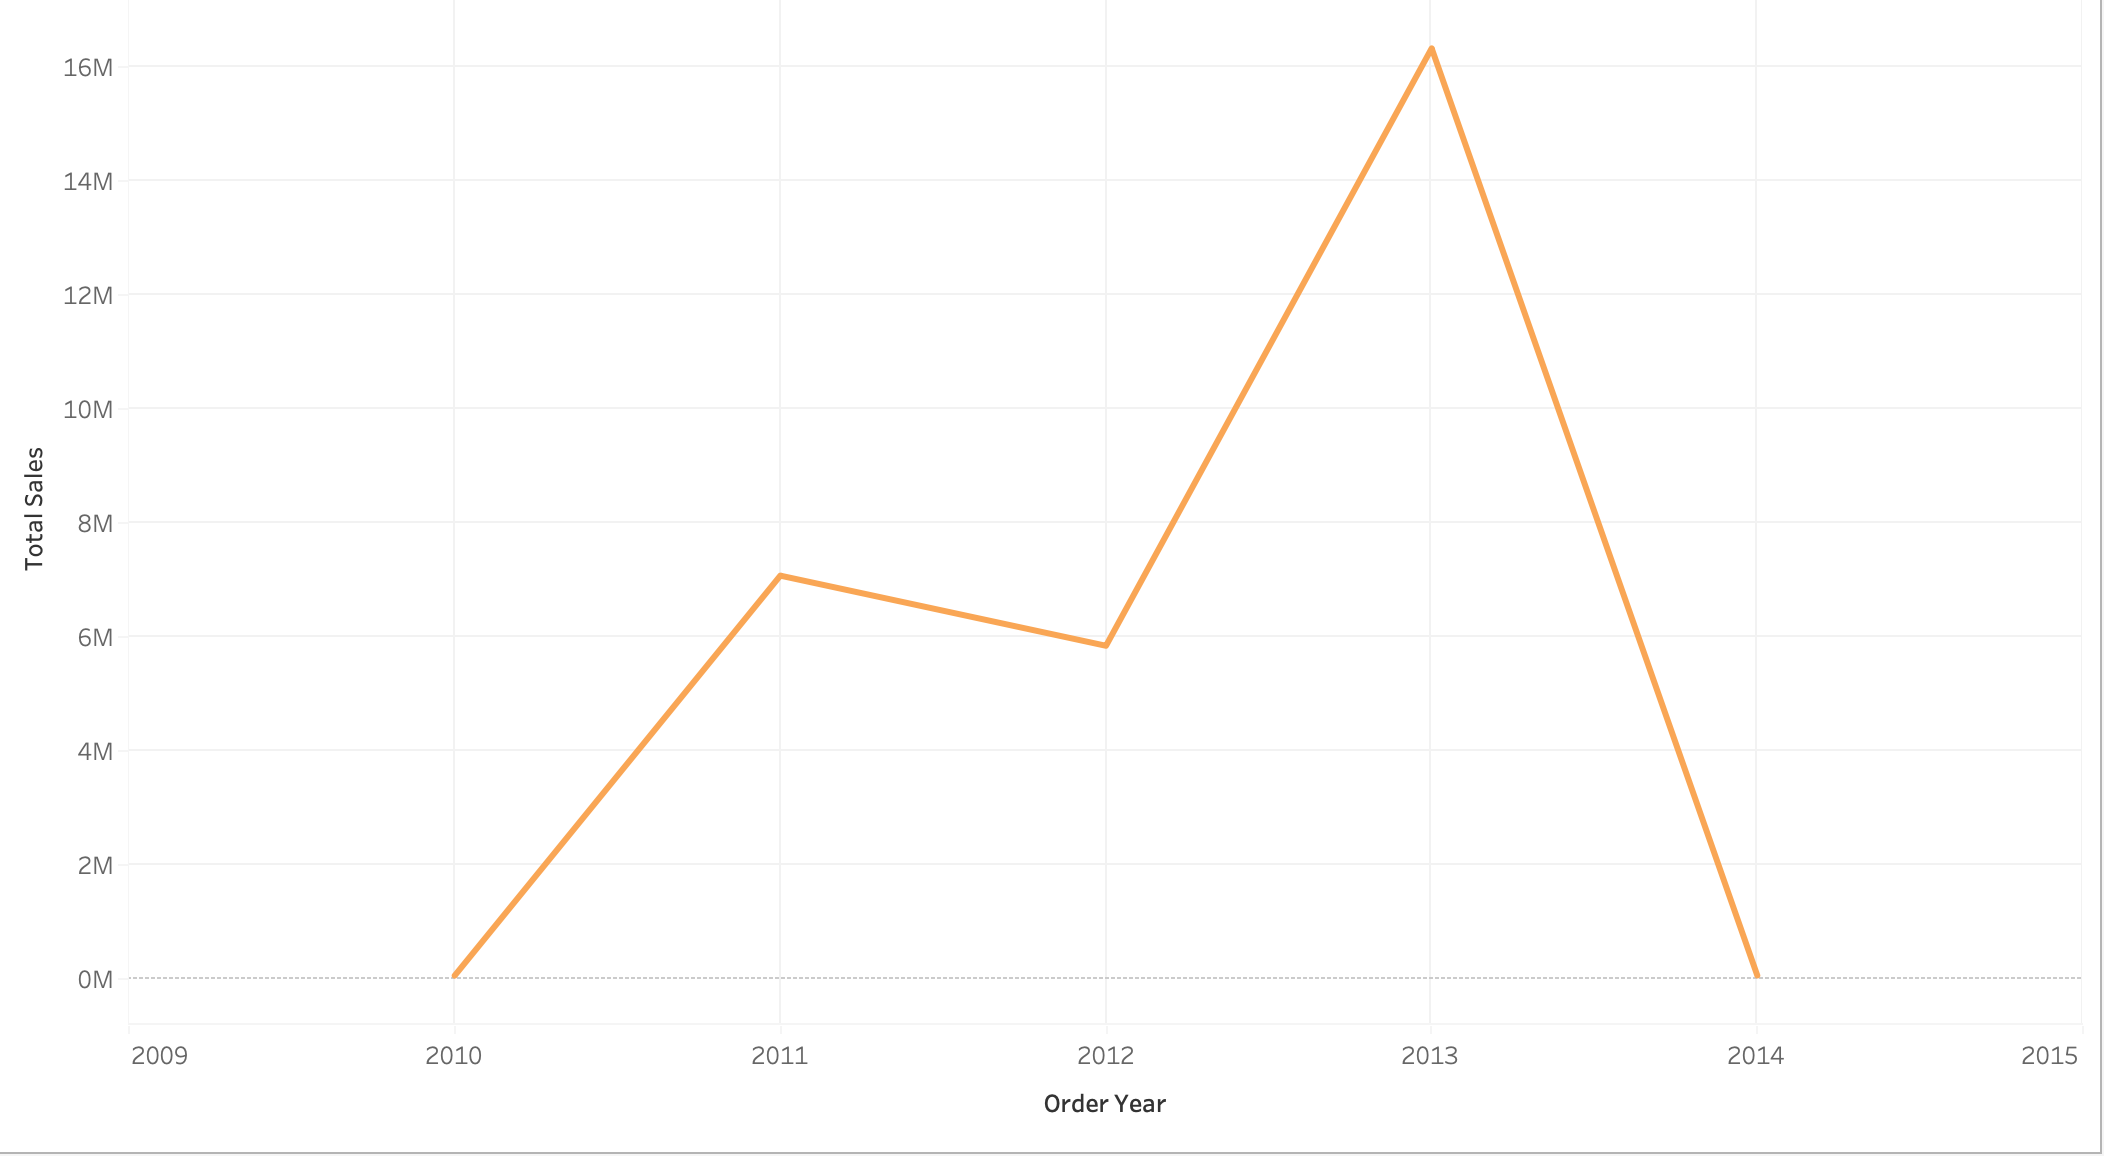
Sales Trends and Cumulative Analysis
To understand long-term performance, I aggregated sales by year and computed cumulative running totals and a moving average over time. This provides a smooth view of revenue growth and helps separate structural trends from short-term fluctuations.
Dashboards and Visualizations
I connected Tableau directly to the Gold schema to build interactive dashboards. The customer overview dashboard includes KPIs, segment distributions, age-group breakdowns, and a recency vs. revenue scatter plot. A separate view visualizes yearly sales with bars for annual totals and lines for cumulative revenue and moving-average trends.
Data Quality and Governance
Throughout the pipeline, I implemented checks for missing or invalid dates, negative quantities or prices, and duplicate customer records. All Silver and Gold tables include load timestamps so data freshness can be monitored. Business rules for segmentation and filtering are documented alongside the SQL scripts, supporting transparency and reproducibility.
Project Impact and Applications
This project demonstrates an end-to-end data warehousing workflow: from planning in Notion and modeling with draw.io to implementing SQL transformations and building dashboards. It shows how structured layers and a star schema make it easier for business users to explore customer value, product performance, and sales trends without needing to understand the complexity of the raw source systems.
Deliverables
- GitHub repository with SQL scripts for Bronze, Silver, and Gold
layers.
- Draw.io diagrams of the data flow, warehouse layers, and star
schema exported as images and embedded on this page.
- Tableau dashboards for customer analytics and sales trends.
- This written report summarizing design choices, methodology, and
key insights.