Exploratory Data Analysis of Sales Data in SQL
This project showcases how I use SQL as an exploratory data analysis tool on a star-schema sales data mart built from CRM and ERP sources. Before building dashboards or advanced models, I wanted to understand the structure of the data, its coverage over time, and the basic behavior of customers and products. The analysis focuses on answering practical questions such as “How big is the business?”, “Who are the most valuable customers?”, and “Over what time horizon do we actually have trustworthy data?”.
1. Understanding the Data Structure
I started with a structural exploration of the warehouse using the
INFORMATION_SCHEMA views. Listing all tables across the
Bronze, Silver, and Gold schemas gave me a quick inventory of what
is available and how the pipeline is organized. This step is useful
not only for orientation, but also for validating that all expected
objects were created correctly after the ETL processes.
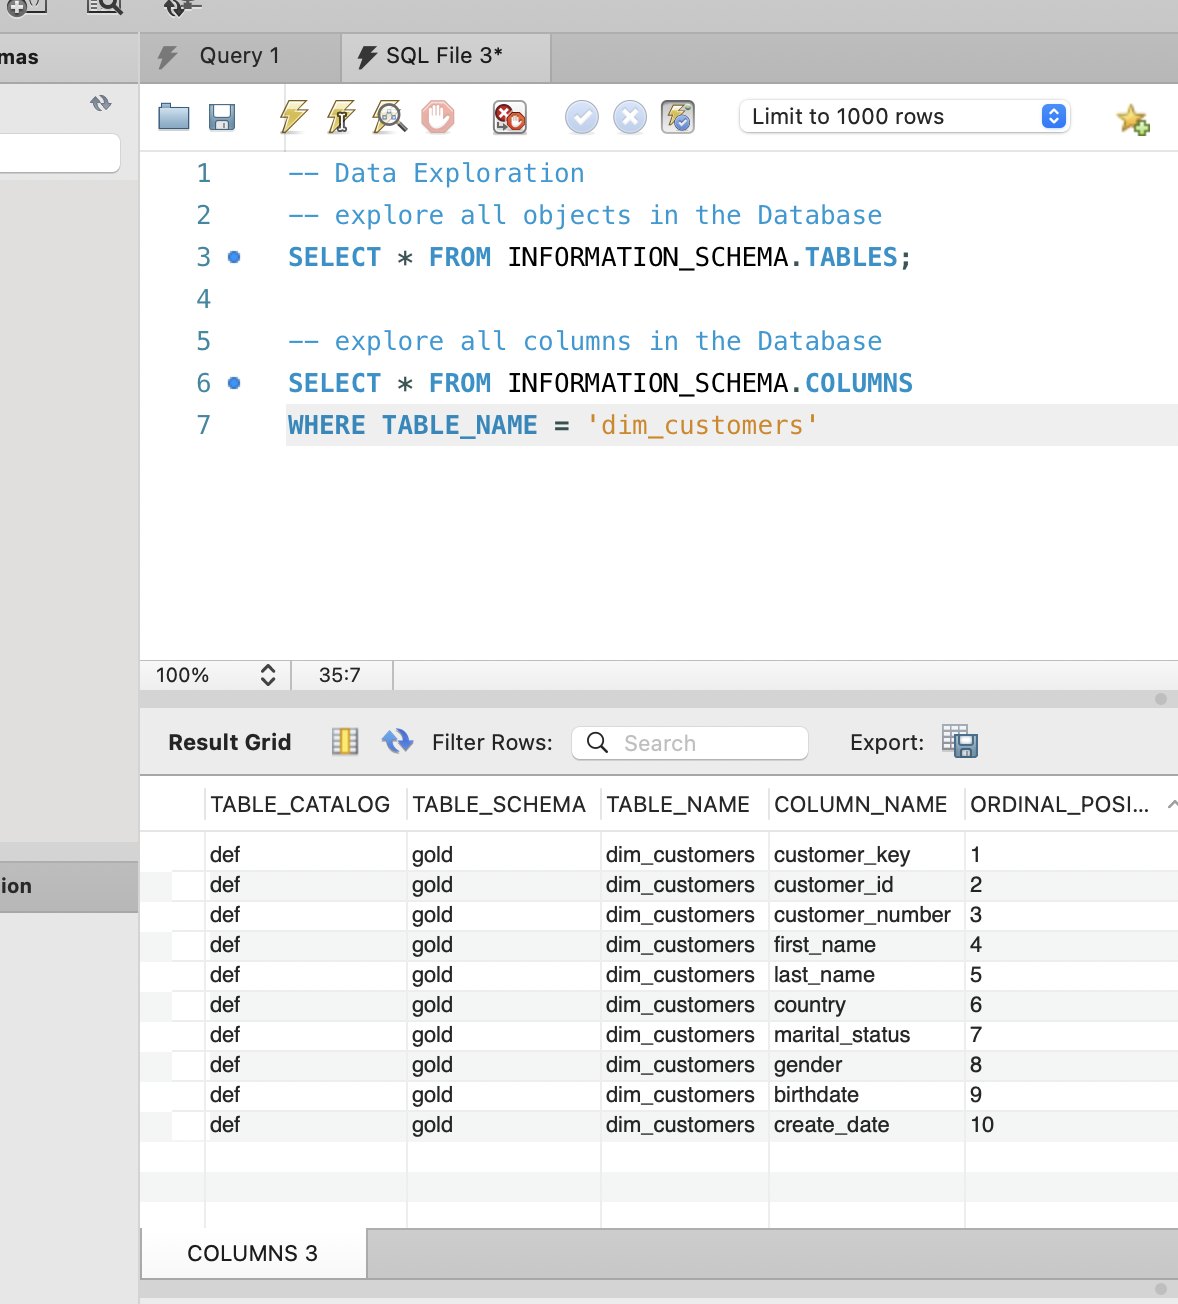
After confirming the list of tables, I drilled into
dim_customers to inspect its columns and data types.
Understanding fields such as customer_key,
birthdate, country, and
gender helped me plan later analysis around customer
demographics and segmentation. At this stage I am not doing any
statistics yet, just making sure I fully understand how the data is
modeled and where each business concept lives.
-- List all tables
SELECT *
FROM INFORMATION_SCHEMA.TABLES;

-- Inspect columns of the main customer dimension
SELECT *
FROM INFORMATION_SCHEMA.COLUMNS
WHERE TABLE_NAME = 'dim_customers';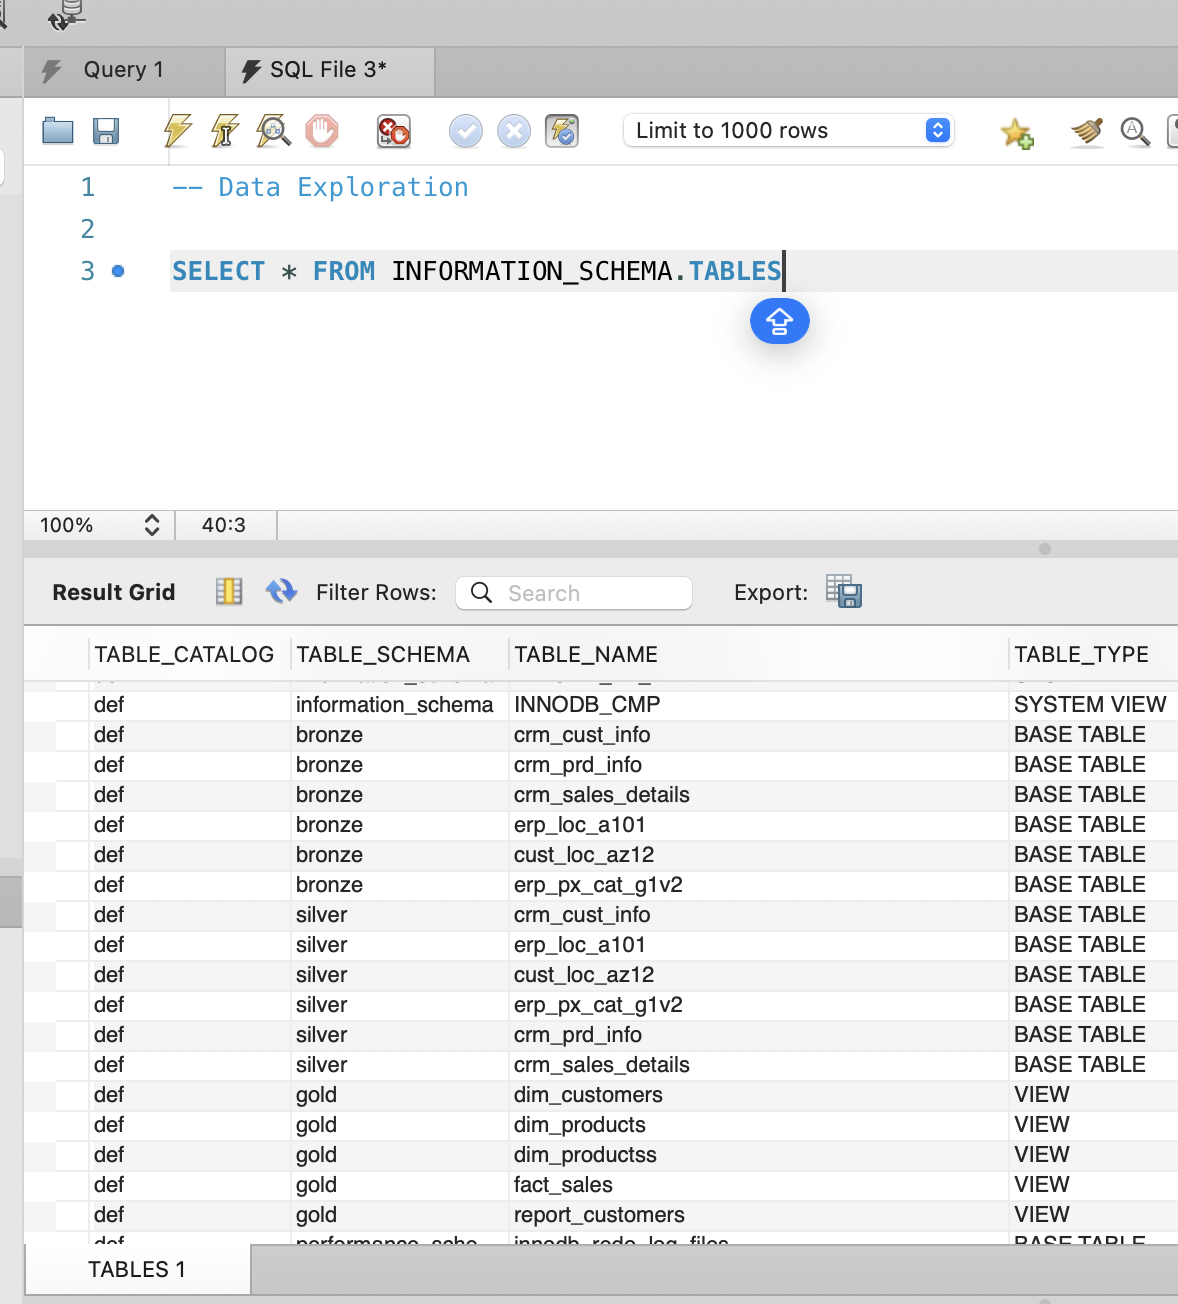
2. Date Coverage and Customer Demographics
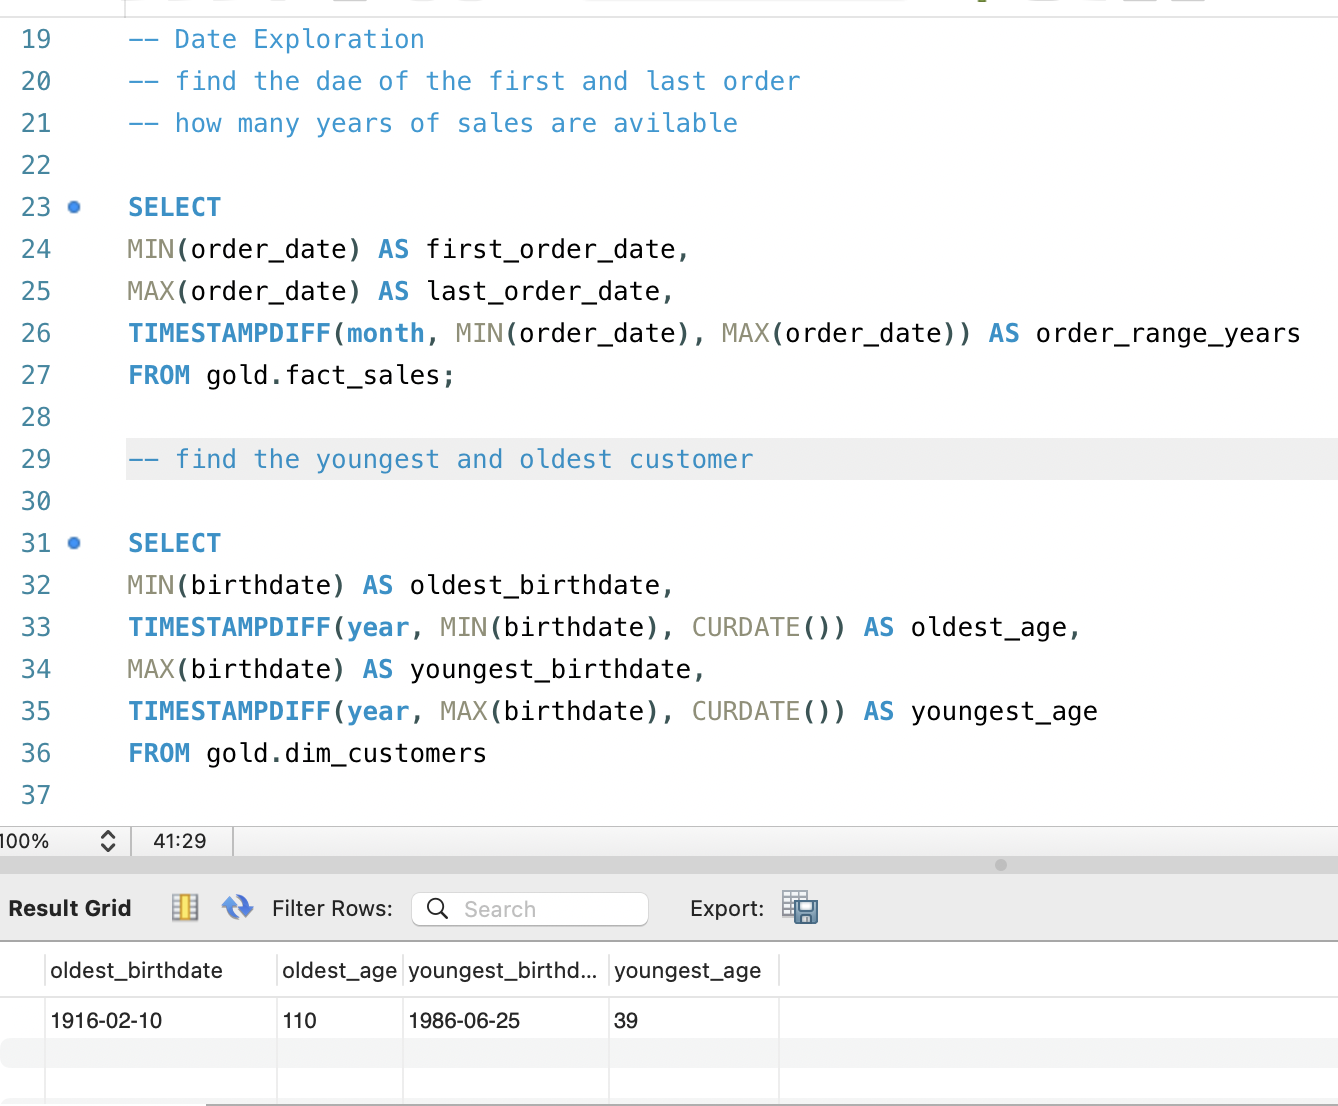
Once the structure was clear, I focused on time coverage, because
every downstream analysis depends on knowing “from when to when” the
data is reliable. By finding the first and last order dates in
fact_sales and computing the range in months, I could
see exactly how many years of sales history were available. This
helps prevent mistakes like drawing conclusions about seasonality
when only a short window of data actually exists.
In parallel, I examined basic customer demographics by calculating
the youngest and oldest customers in dim_customers.
The age span tells me whether the dataset is focused on a specific
life stage, such as young adults, or whether it covers a broader
population. That context matters when interpreting future insights
about purchasing patterns, average order value, or responsiveness to
campaigns across age groups.
3. High‑Level Business Metrics
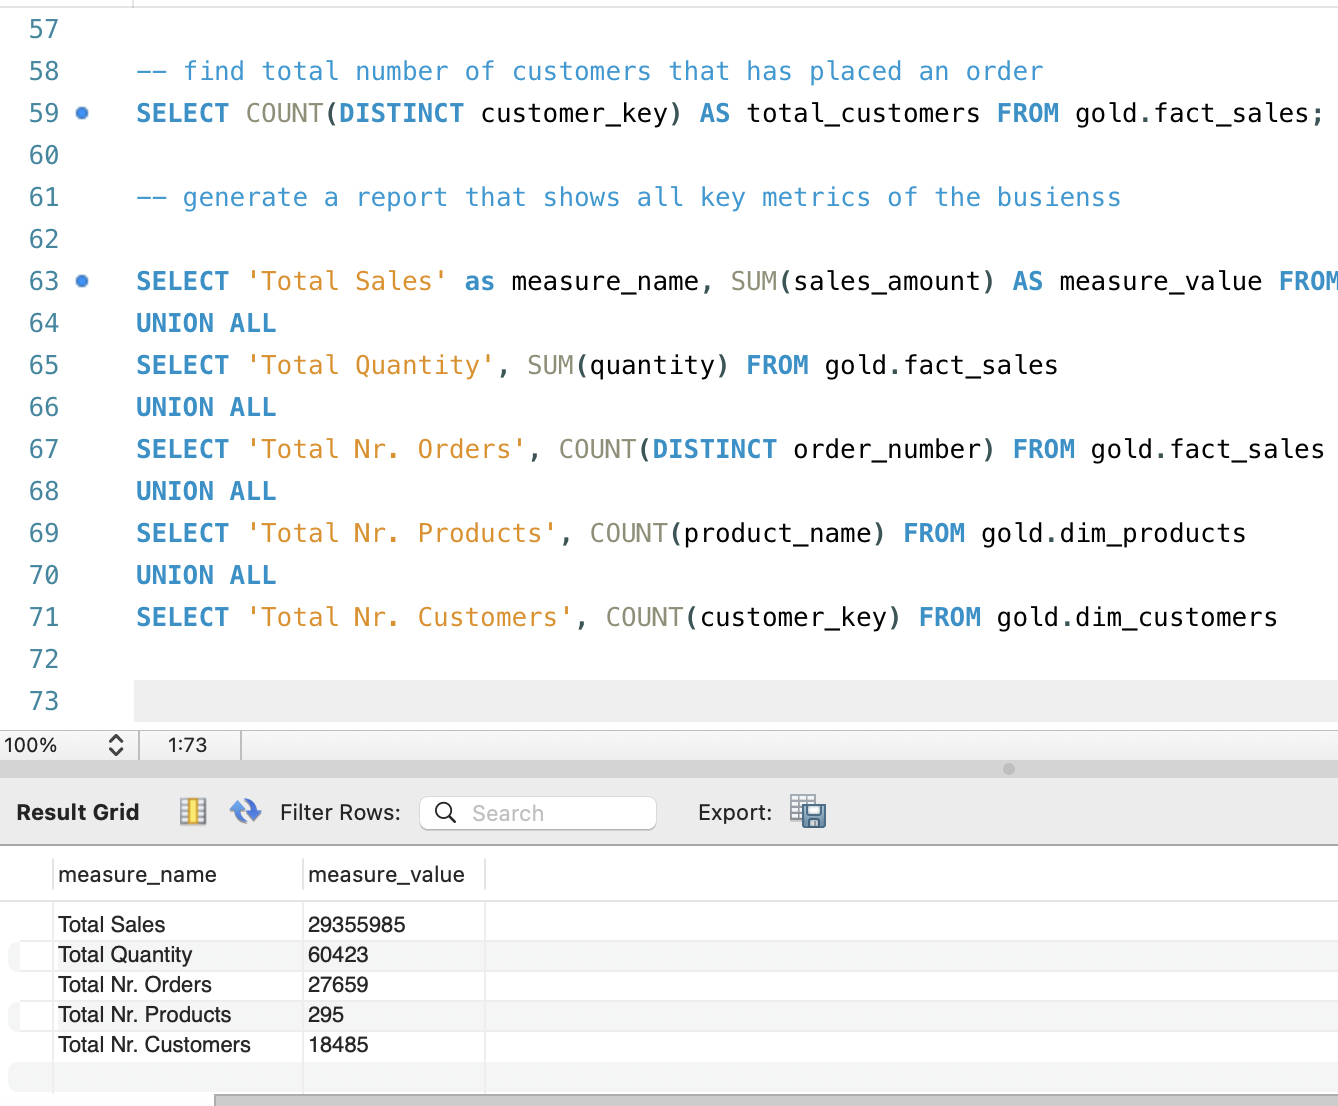
After understanding the temporal and demographic context, I wanted a
concise view of the overall business scale. Instead of running
separate queries for every metric, I combined several aggregations
into one compact “KPI table” using UNION ALL. This
report summarizes total sales, total quantity sold, number of
distinct orders, number of active products, and total number of
customers present in the warehouse.
Having these metrics in a single result set is very convenient when sharing early findings with non‑technical stakeholders. It reads almost like the top row of a dashboard, but is generated directly in SQL. It also serves as a quick sanity check for the data engineering pipeline: if the numbers are unexpectedly low or high, that may indicate issues in the ETL or filters applied upstream.
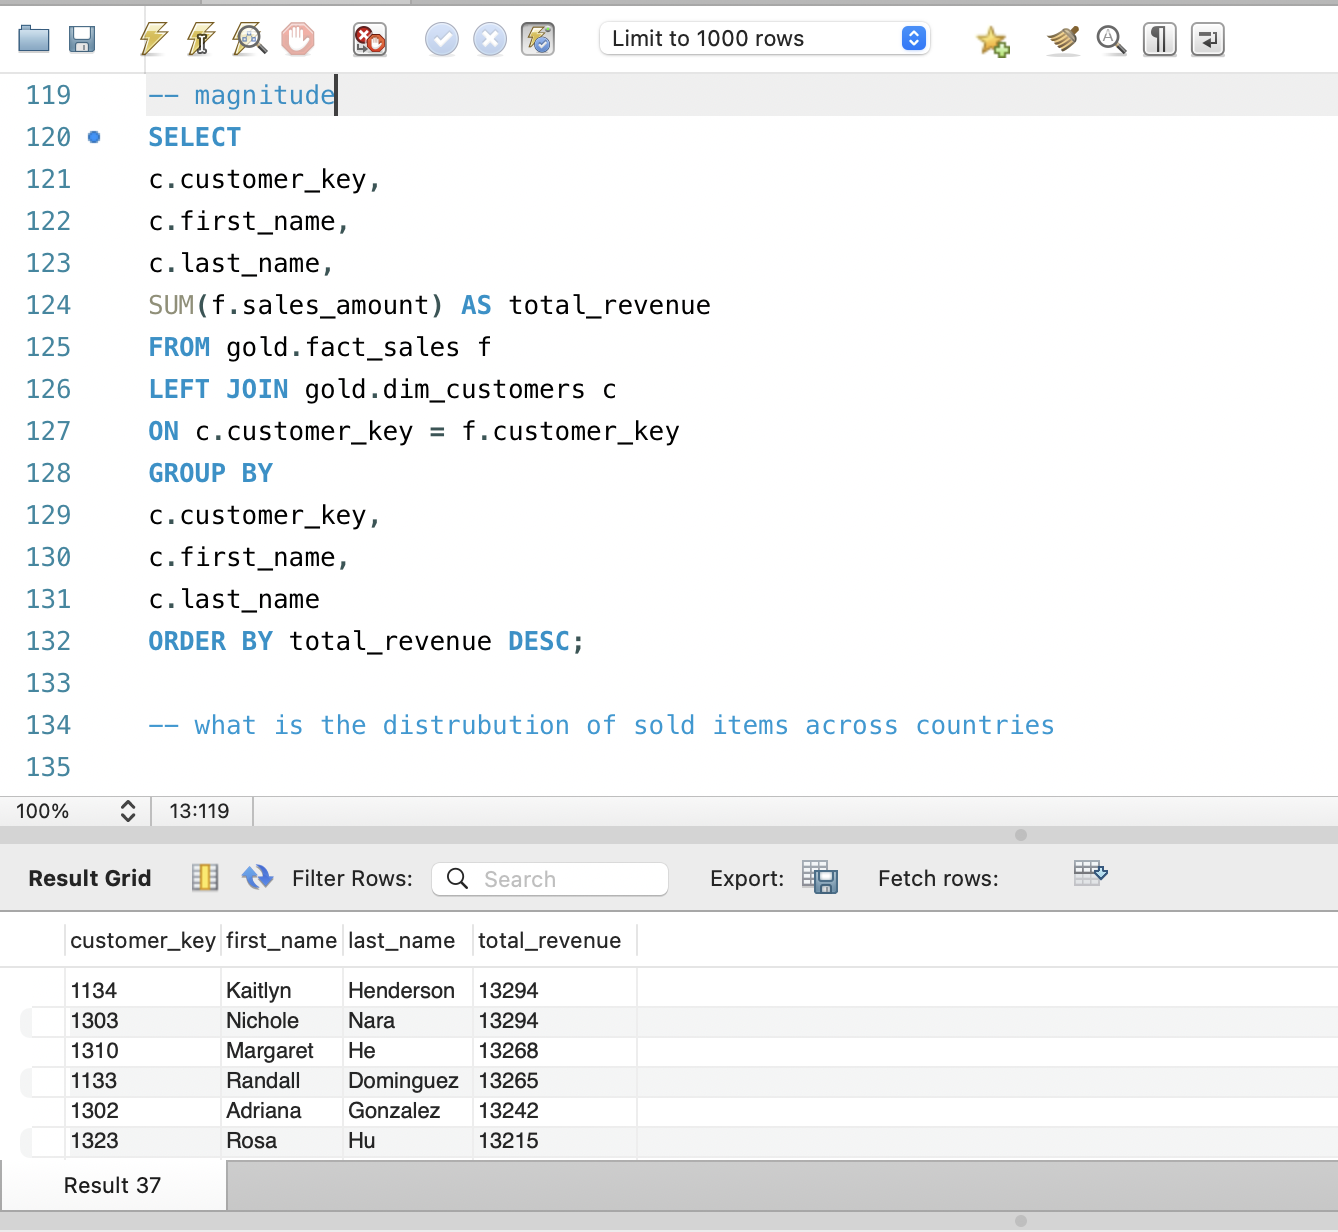
4. Customer Revenue Distribution
A core EDA question for any commerce dataset is how revenue is
distributed across customers. To answer this, I joined
fact_sales with dim_customers and summed
sales_amount per customer, then ordered the results by
total revenue. This query immediately reveals whether the business
depends on a small group of high‑value customers or whether revenue
is evenly spread across the customer base.
The output can be exported to a spreadsheet or visualization tool to build Pareto charts or cumulative distribution plots, but even in raw table form it already provides powerful insights. Seeing actual names and keys attached to the highest‑revenue rows makes it easier to think about next steps, such as creating VIP segments, designing tailored campaigns, or examining churn risk among the most valuable customers.
5. Key Insights from the SQL EDA
Overall, the SQL‑based exploratory analysis confirmed that the data warehouse is structurally sound and analytically rich. I verified that the star schema is complete, that sales data spans a meaningful time window, and that the customer base is large enough to support segmentation and behavioral analysis. The quick KPI table provides a baseline understanding of business scale before any dashboards are even opened.
The customer revenue exploration showed that a relatively small set of customers contributes a substantial portion of total sales, suggesting clear opportunities for VIP programs and retention strategies. These EDA findings directly influenced how I designed the Gold‑layer customer report and Tableau dashboards in the broader data warehouse project, ensuring that visualizations and metrics focus on what is actually most important in the underlying data.